When a temperature range is listed on a specification sheet, it is often the extreme limits of the product. To get to those temperature ratings, modifications or special configurations may be required. For instance, to reach a higher temperature, a lag may be added to the level switch to move the electronics away from the heat source. Temperature charts are created to illustrate the limits of a design configuration, and it's important to know how to interpret them properly.
- Ambient Temperature: Ambient temperature is also known as operating or outside temperature; it is the temperature where the level monitor's electronics will be located. In high process temperature applications, a unit's ambient can be higher than environmental temperature due to radiating heat of the silo or surrounding air.
- Process Temperature: Process temperature is the temperature inside a silo or tank where the process is working, where the material is in contact with the sensor.
Download the Temperature Charts
Roto-Bin-Dicator® Temperature Chart
VRF® II Series Temperature Chart
Pulse Point™ II Series Temperature Chart
How to Read A Temperature Chart
Examples
Example 1: VRF® II Series
Ambient Temperature = 145°F and Process Temperature = 950°F
Answer: Referencing the chart, a 12 inch lag configuration will be needed.
Example 2: Pulse Point™ II Series
Ambient Temperature = 150°F and Process Temperature = 230°F
Answer: Referencing the chart, no lag is needed – a standard, internal configuration can be used.
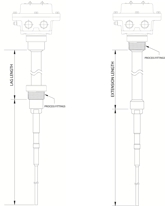
When do I Use a Lag Versus an Extension?A lag is used to get electronics away from higher temperatures, putting more space between the process fitting and the frame of the unit. An extension is used to position the sensing mechanism closer to the material, extending down or out into the vessel. Lags and extensions are available with Roto-Bin-Dicator® Models, VRF® II Series and Pulse Point™ Series. |
 |
|


